Day 1 of 100 Days of Code
Learning the basics of numpy, pandas and plotly

Today I officially committed to the 100 Days of Code challenge on Twitter! A small but important step for me. One of my learnings from the past year was that I'm more likely to follow through on my intentions when I have accountability and am part of a group of people pursuing the same activity - whether it's reading a book, working out or learning to code. Publicly committing to the 100 Days of Code challenge is both exciting and terrifying for me, but either feeling should motivate me to stick with it and finally achieve my coding hopes and dreams - learning how to design and develop web applications and create interactive data visualisations!
My coding journey so far:
Over the past years, I have dabbled in coding, picking up some basic SQL for work, learning some HTML and CSS to create a basic website, and whizzing through a 12-week Intro to Data Science course where I was introduced to Python but got a bit overwhelmed with all the libraries and syntax. Then there's the graveyard of online courses which I started but never finished (such as Harvard's famed "Intro to CS 50" on Coursera, or Unity's Junior Programmer videos because, randomly, I was also keen to learn game development for a while). Most recently, I started Angela Yu's "100 Days of Python" course on Udemy - I made it to Day 16 and then just fell off the bandwagon. Bottom line is, I haven't reached any level of competency in any programming language and haven't really built anything either. Admittedly, my attention span is short, I get excited very easily about new courses I discover, I love reading inspiring stories about other people's developer journies, but struggle to stick with one format for a long time.
My plan for the next 100 days:
At the end of 2021, I decided to pick up Python again, and focus on just Python for at least six months or so, until I have built several web apps with Flask and / or Django (and I'm not talking about simple "To do" apps and other beginner projects). Python feels like the most useful language for me specifically because it's versatile, relatively easy to learn (at least it has an easily readable syntax) and it's part of the tech stack we use at my work. I want to learn Python to be able to build stuff as a creative outlet for me, but also to better understand the technical side of my company's products (it's a B2B payments and credit start-up), such as how APIs work, and to create cool visualisations of data (because I love insights!).
Over the next 100 days, I will therefore dive into how to build web apps with Python, using Flask and Django, and creating data visualisations with Plotly and Dash.
Today I learned:
I have been going through the "Interactive Python Dashboards with Plotly and Dash" course on Udemy. Today I learned the basics of the numpy, pandas and plotly libraries. Numpy is a scientific computing & mathematical library which allows us to quickly generate arrays or matrices of data. Pandas is a library built on top of numpy, which allows Python to read in data sets from various formats such as .csv files. Plotly enables visualisations with basic interactivity (e.g. zooming in) in an html file. I like to code along the tutorial videos and diligently do the exercises with the data provided. However, I then also try to use other data, that I personally find interesting, to practice with. Today I picked average house prices for London and after a few painful hours created the following graph (I removed years preceding 2005 and a few boroughs to make it less cluttered):
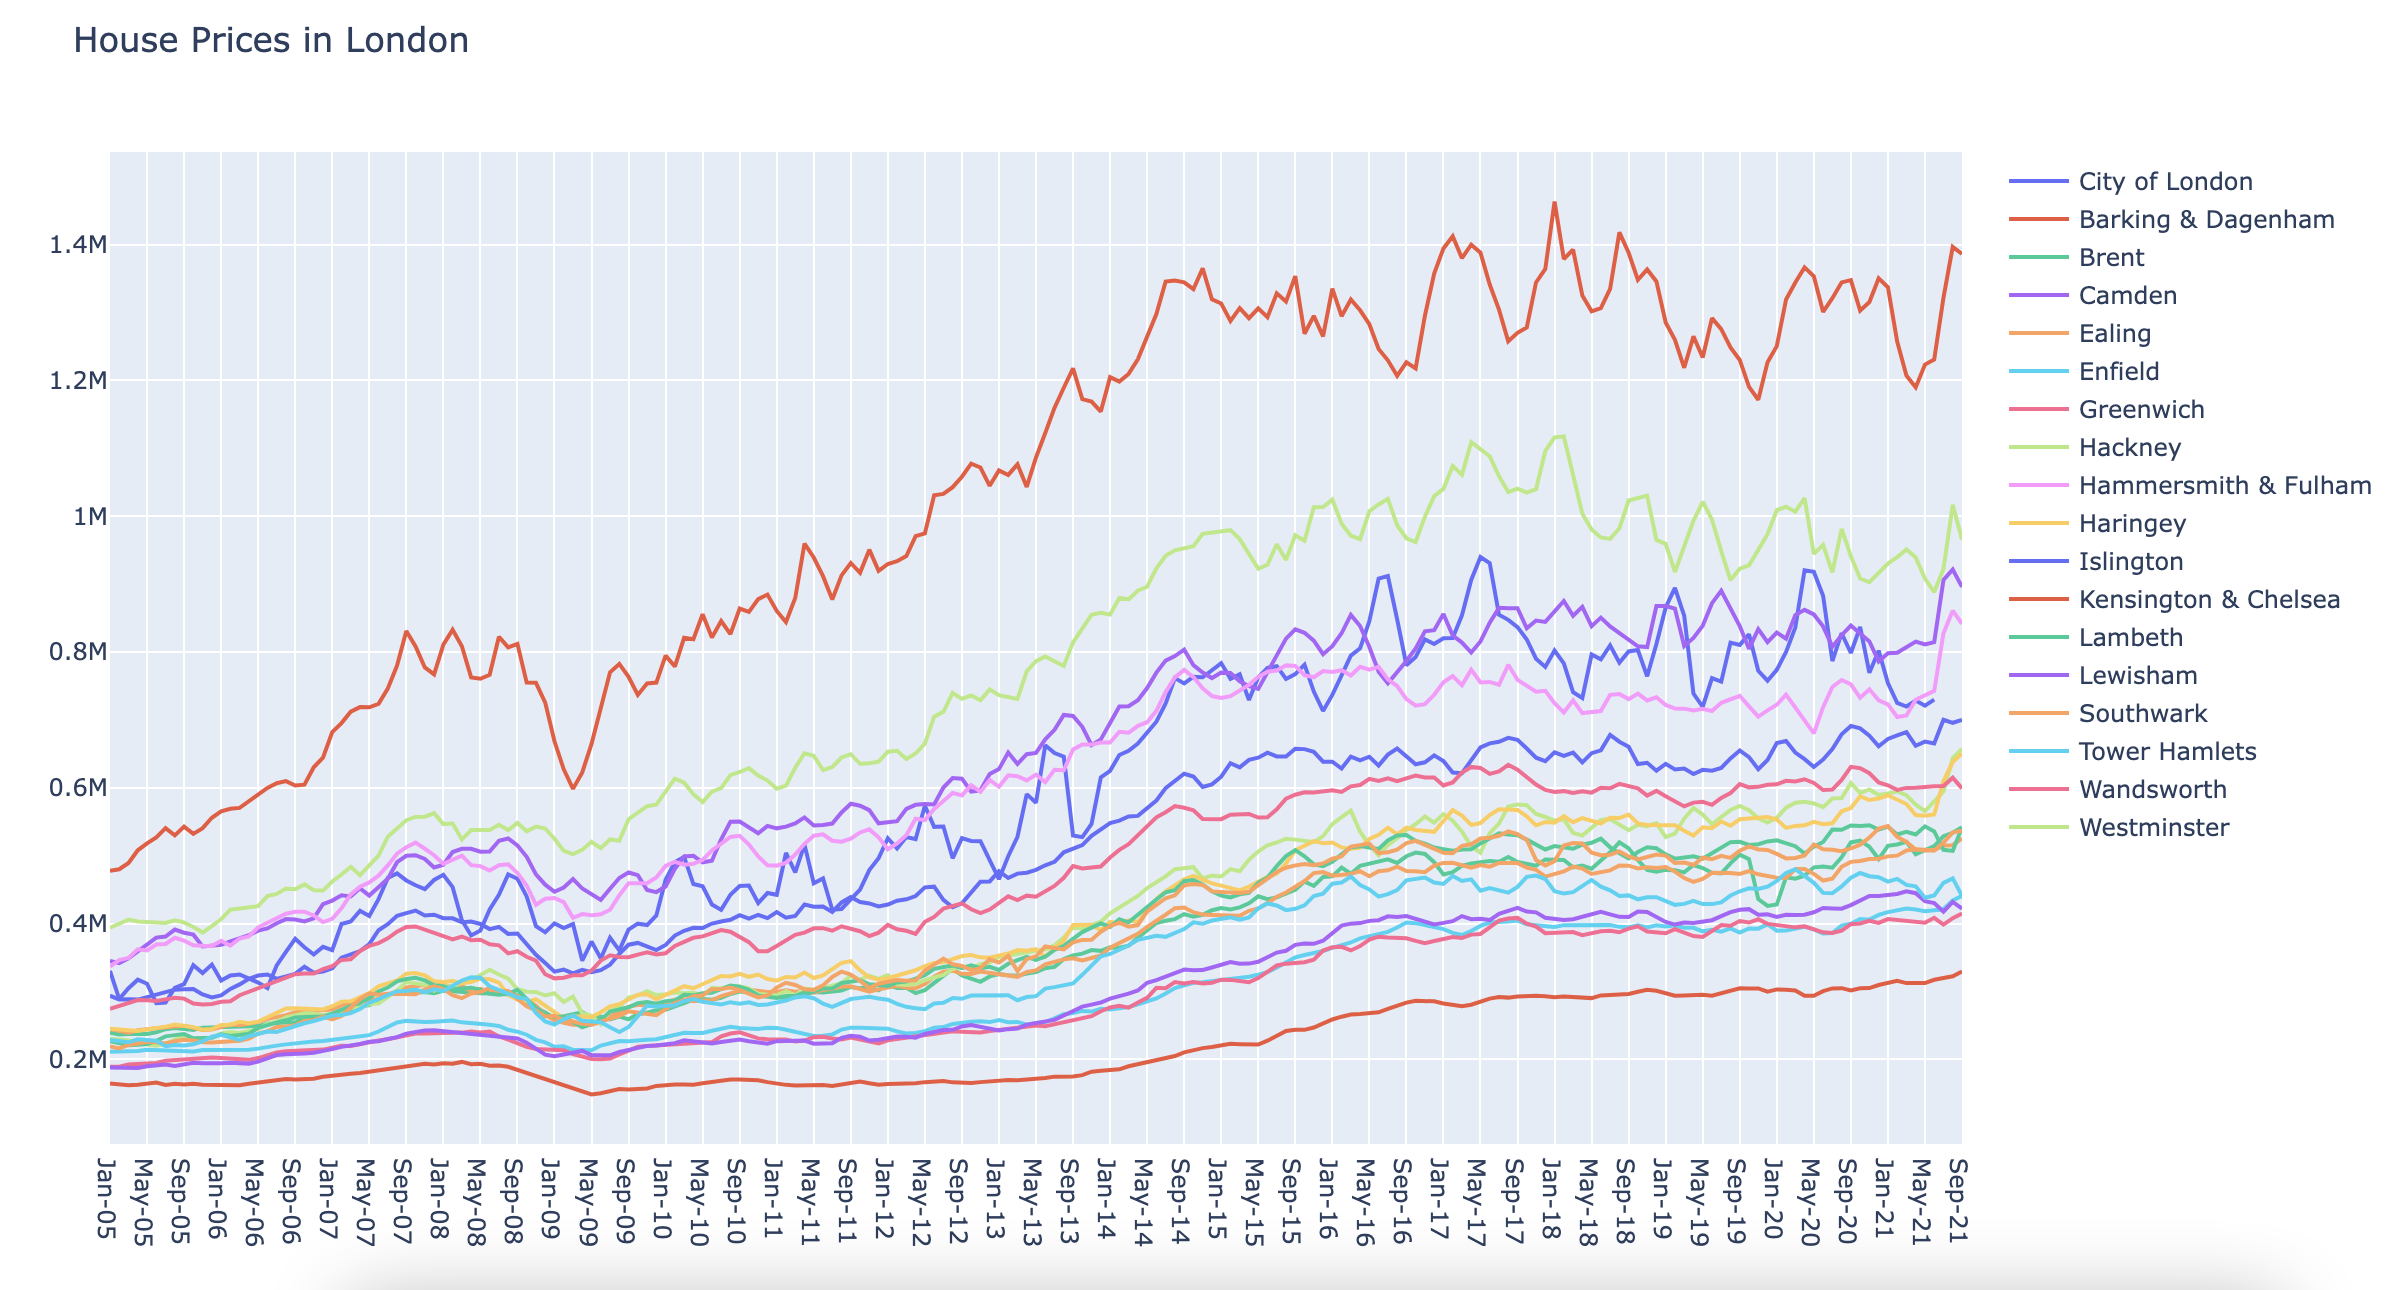
These are some pretty eye-watering house prices. What I find most interesting is that in January 2005, the difference between the most and least expensive borough was barely 3x, i.e. Kensington & Chelsea had an average house price of £478K, which was 2.9x as high as Barking & Dagenham's average house price of £164K. However, fast forward to September 2021, and the average house price in K&C has ballooned to £1.4M, while B&D has merely doubled to £329K, so now the difference between the most and least expensive borough is 4.2x. In absolute terms, though, house prices in London are ridiculous, period. Tomorrow I'll continue learning about Plotly and also get started on Dash, so my next visualisation will hopefully be a bit more animated!


